In this lab, we used CrimeStat to conduct a Nearest Neighbor Analysis, Fuzzy Mode Hot Spot Analysis, Nearest Neighbor Hierarchical Clustering, and Risk Adjusted Hierarchical Clustering. These analyses can identify the relative risk of and crime hot spots in Ottawa.
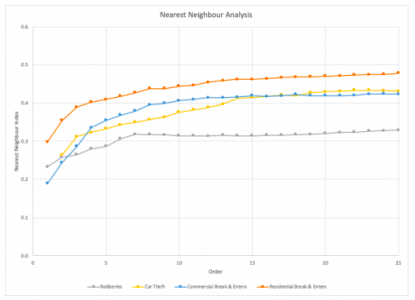
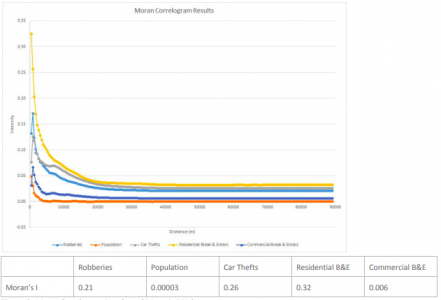
First, I looked at the nearest neighbour index to see if there was spatial autocorrelation between crimes. Then I compared it to the Moran’s I results. The graph of the correlograms indicates whether the “hotspots” are randomly distributed, clustered, or dispersed.
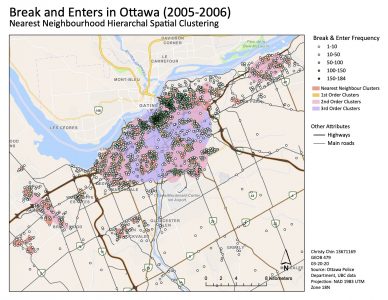
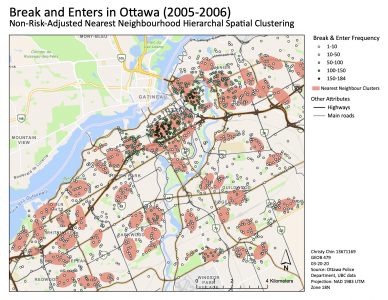
The fuzzy mode, in this case, enabled us to identify hotspots for crimes in the Ottawa downtown area. From the Nearest Neighbour Hierarchical Spatial Clustering map, we can see that there are higher break and enter frequencies and more concentration of ellipses in the downtown area. As you move away from downtown, the break and enter frequency is lower and there are fewer ellipses.
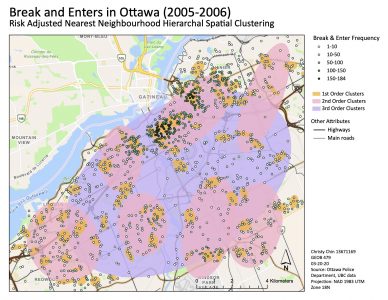
As seen in the non-risk-adjusted (standard) neighbour analysis, they are more scattered across the map. This could be caused by the use of absolute data. The first order clusters show a somewhat similar pattern as the Nnh results however, they are more centralized in the downtown area. The second and third order clusters clearly shows that most of the clustering is found in the downtown area. Although the second and third order ellipses are much larger, we can see that they are typically gathered at the hotspot (downtown area).
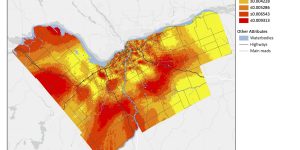
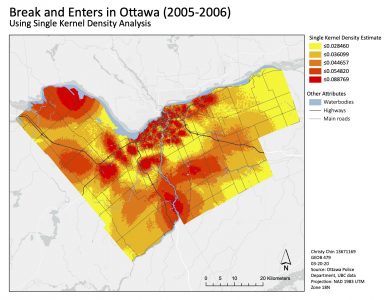
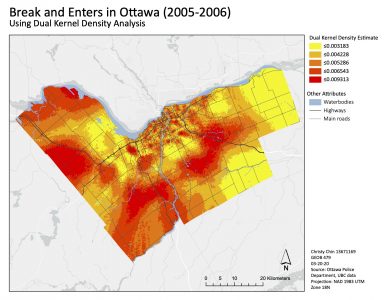
In the single kernel density results (figure 7), the downtown area seems to have a higher kernel density estimate. However, we can also see that the values are much lower. The dual kernel density map (map 8) is normalized by the total population per dissemination area over 15 years of age. Instead of estimating clusters of the overall crime (single kernel density), it also estimates the relative risk. In doing so, we can also see other hotspots outside of the downtown area.
Learning Significance