Storm Surge in MetroVancouver
Geological and climate change has led to many unexpected weather events, some that are the result of atmospheric pressure changes and wind associated with storms. Metro Vancouver is one of the cities that are at risk of flooding and storm surges. I have created four maps to analyze the areas in Metro Vancouver that are at risk of being affected.
Map Analysis:
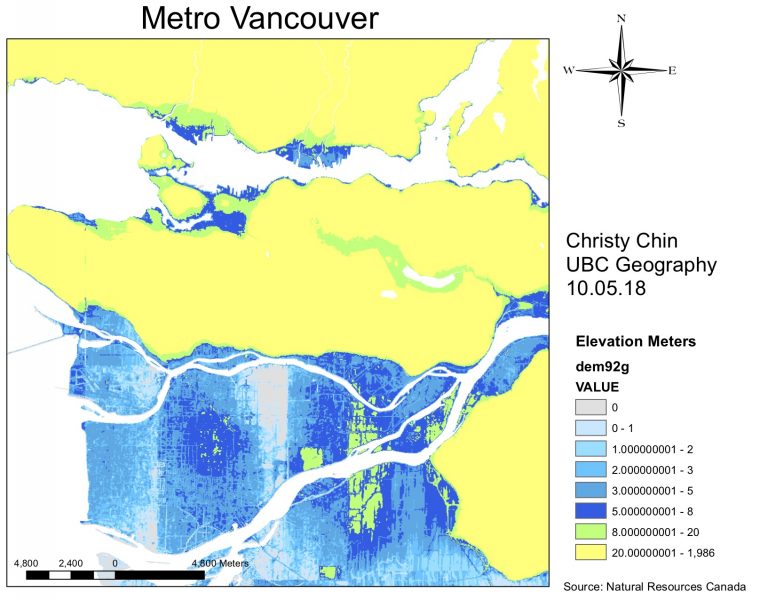
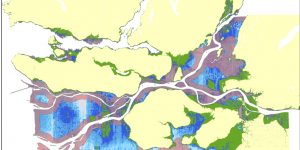
The map above symbolizes the different elevations in Metro Vancouver. The elevations range from 0 metres to 20 metres and above.
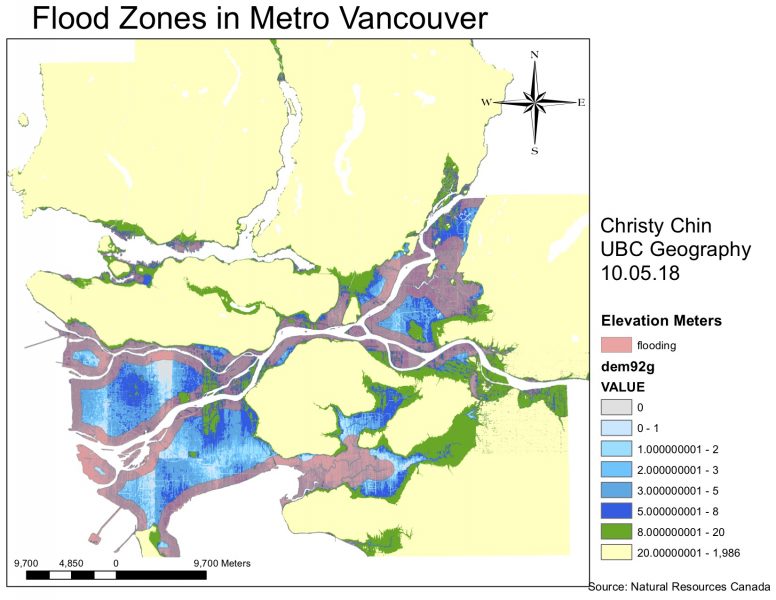
‘Flood Zones in Metro Vancouver’ are areas that are at risk of flooding. The bordering pink areas are 1 kilometre from the shoreline.
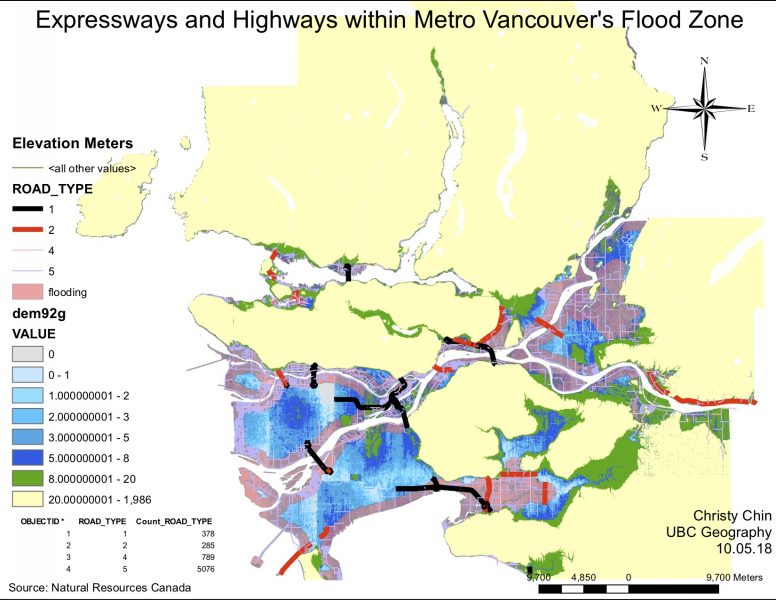
‘Expressways and Highways within Metro Vancouver’s Flood Zones’ shows the different road types within pink flood zones. The black and red roads represent the expressways (1) and highways (2). A chart at the bottom of the map are the number of roads for each type of road.
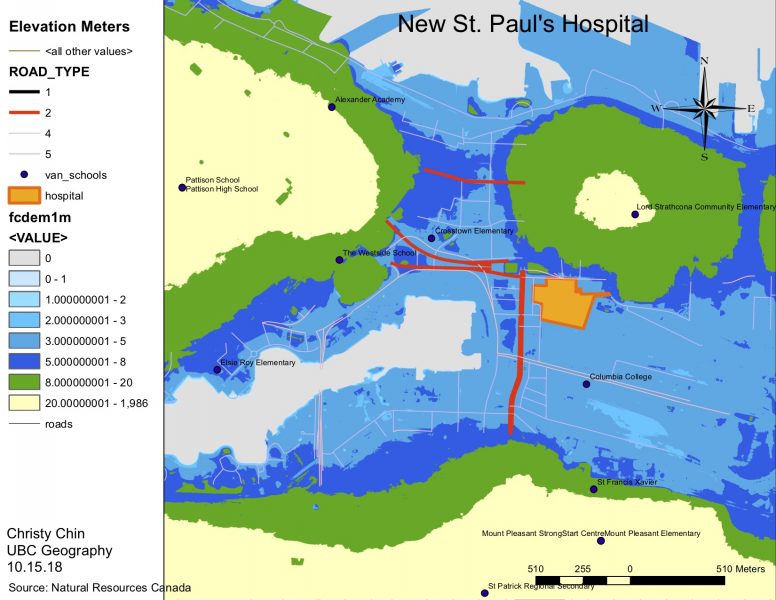
‘New St. Paul’s Hospital’ is represented by the orange polygon. The surroundings colors show that it is to be built on a low elevated area.
Conclusion from the Analysis:
- Most areas near the shoreline that are 8 metres and below are at risk of flooding.
- Flooding is possible inland by the shore of rivers.
- There are 6 Vancouver schools that are in flooding zones are found in Downtown Vancouver.
- Some of the frequently used and busy expressways and highways are at risk of flooding and storm surges. These roads that are at risk are also used to cross rivers (e.g. Vancouver to Richmond and Richmond to Delta).
- Comparing the ‘Flood Zones in Metro Vancouver’ map and ‘New St. Paul’s Hospital’ map, it shows that the hospital is being built in an area that is also in danger of flooding and storm surges.
DEM resolution:
DEM92g’s Resolution: 25,25
FCDEM1M’s Resolution: 1,1
Error and Uncertainty:
The strength of the flood and storm surge is uncertain as well as other factors such as precipitation.
New Skills Acquired
- Acquired dataset that is not open or public data from Open Data Canada and City of Vancouver
- Reclassified DEM and buffered shoreline to show low elevation areas that are vulnerable to flooding
- Converted raster into vector in order to combine layers that shows areas that are susceptible to a storm surge (within 1km buffer and less than 8m in elevation).
- Created a table of total length of highways and expressways that are within potential flooding zones.
- Digitized a new polygon feature of the New St. Paul’s Hospital
Learning Significance