Quantitative Data Classification
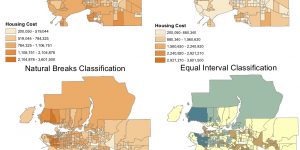
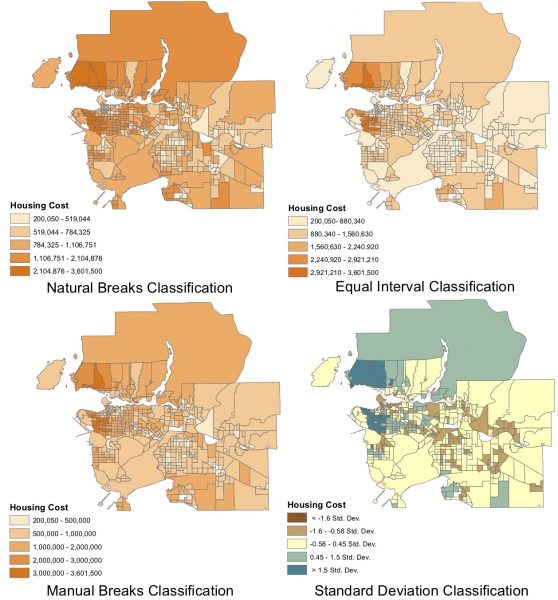
Natural Breaks Classification takes into consideration of the distribution of areas. It divides classes where there is a significantly big difference in data values and is great for mapping unevenly distributed data. The goal of using Natural Breaks is the homogenization within classes and heterogenization between classes. Natural Breaks classification has the least amount of error compared to other classifications. As shown in the map, the gradients in color are evenly spread; the map is not especially light and dark in only some areas.
Equal Interval Classification takes the range of the data, subtracting the highest value to the lowest value, and divides evenly into different classes (number of classes vary). This type of classification works for a uniform data set rather than skewed data set. If it is used for highly skewed data set, it could result in data with no values or a value of “0”. The map shows the same data as Natural Breaks Classification however, it is mostly light and only dark in certain areas. The legend also shows the difference in range of housing cost. Prices that are particularly high are part of the lighter gradient.
Manual Breaks Classification are breaks with manually entered rounded values. It is mainly used to compare two datasets for different places. It considers the distribution of the data for the first dataset, then it is used on the second dataset. As shown in the map, the housing costs are manually entered into five classes. The values are not exact but a rounded set of value.
Standard Deviation Classification calculates the mean and the standard deviation of the data. It is useful to show areas below the mean or areas above the mean. This type of classification clearly shows spatial representation of high values and low values in a fashion of equal importance of all areas. As shown in the legend, values are not prices but the standard deviations that are lower or higher than the mean. The light regions are the mean values while darker regions show the lower or higher values.
Data Uncertainty
Median cost was used to analyze Vancouver dwelling costs instead of the average because the median can not be influenced by significantly higher or lower prices. Therefore it is not pulled toward a certain direction, making it less distorted or biased.
Shelter Cost to Income Ratio of private household refers to the proportion of average total income spent on the shelter cost. Shelter cost to income ratio shows the affordability of a house for people of different income range. It can be used to understand if a person’s own income is able to afford a certain area. The data is typically more trustworthy based on the method it is measured. (http://www23.statcan.gc.ca/imdb/p3Var.pl?Function=DEC&Id=103407 )
Value (owner estimated) of private dwelling refers to the expected selling price. It is useful for showing the estimated value of houses in certain areas. It is also helpful to know the areas in which a person is able to afford. (http://www23.statcan.gc.ca/imdb/p3Var.pl?Function=DEC&Id=252218)
Census tracts (CT) cover a larger area, meaning that more data allows for a wider range of data values; the data for census tracts gives a general value of the area. Due to the larger area, census tract areas typically stay stable over time; it rarely changes. There are 19 census tracts with a “0” as their median value of dwelling because data is not collected for private households living in band housing or located on an agricultural operation that’s operated by a member of the household, or for households who rented the dwelling. (https://www12.statcan.gc.ca/census-recensement/2011/ref/dict/geo013-eng.cfm)
Dissemination Areas (DA) cover a smaller area, allowing for variation in shelter cost and more accurate representations; the data for dissemination areas are more accurate. There are 127 Dissemination areas with a “0” for their median value of dwelling because dissemination area boundaries respect the boundaries of census subdivisions and census tracts. Therefore remain stable over time, to the extent that census subdivisions and census tracts do. (https://www12.statcan.gc.ca/census-recensement/2011/ref/dict/geo021-eng.cfm)
Housing Affordability
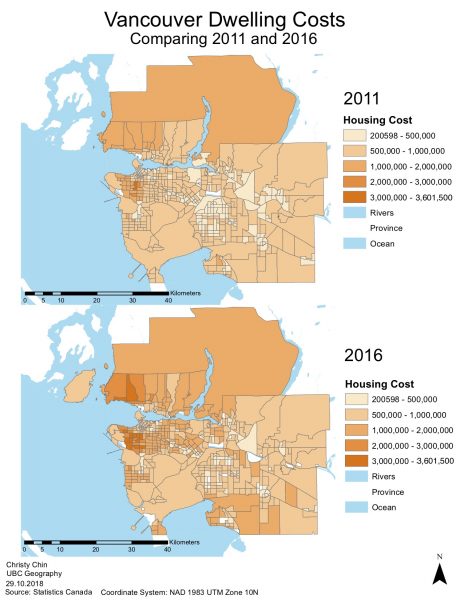
In the map, I have compared Vancouver Dwelling Costs from 2011 and 2016 using the University of Toronto CHASS. The housing cost shown in the map uses manual breaks classification, giving rounded and manually entered values. The census tabular data needed to measure housing cost uses median value of dwelling by owner. In 2011, the ‘long form’ was made voluntary resulting in less detailed information for the data. However, in 2016, the ‘long form’ was reinstated.
Although Vancouver is named one of the most ‘livable’ cities in the world, affordability contrasts this title. The map shows the significant change of housing costs within a five year period. Most areas have an increased housing cost. Most of west Vancouver and North Vancouver is within the $2,000,000 to $3,601,500 range in housing value. The increased pricing has pushed populations to areas on the outskirts of metro Vancouver or further.
New Skills Acquired
- Downloaded spatial and tabular census data from the Abacus Dataverse network and the University of Toronto’s CHASS.
- Joined the tabular data to spatial layers to visualize housing data.
- Created four maps with different classifications (Natural Breaks, Equal Interval, Manual Breaks, and Standard Deviation) to compare the difference in data visualization.
Learning Significance