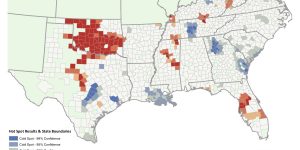
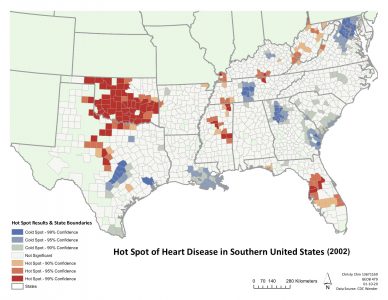
We took data from the CDC’s Wonder Heart Disease dataset to create a hot spot analysis. Maps were made to show the hotspots for heart disease in the Southern United States for each year from 1999 to 2016. A time series was then created with maps from 1999-2016. The year 2012 was selected for a more in-depth written pattern analysis.
As you can see from the map, counties that are within the red scale are shown to have higher amounts of heart diseases compared to areas within the blue scale in which heart diseases are less common than the average among all counties. Oklahoma is a central area with noticeably higher cases of heart disease from 1999 to 2016. The Centers for Disease Control and Prevention (CDC) analyzed the health statistics of Oklahoma which ranked it as one of the top states with the highest mortality rates caused by heart diseases. On the other hand, central Texas, Maryland, and the northern portion of Virginia have a consistently lower amount of heart disease cases. There can be factors that cause more or fewer heart diseases in the states. However, it is important to understand that the average is only among the 16 states rather than the entire United States.
Learning Significance